Here is a customization I’ve done recently for the Health Office department of an international school.
Its purpose is to have a visual representation of the data collected every time a student enters the Health Office (office visits). In our case it will display statistics over “visit types” (as “categories”) and over “visit time” (as the difference between “time_out” and “time_in”).
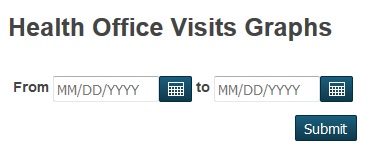
The initial screen displays the title of the page, two date entry fields and a submit button.

You can bound your statistics to a certain time window by filling in both the “from” and “to” fields (or either one or the other, depending on your needs) or leave them both blank in order to get a statistics over the entire history of your office visits records (a “total over time”).
Once you chose your time window you can go on and press the submit button to display the results.
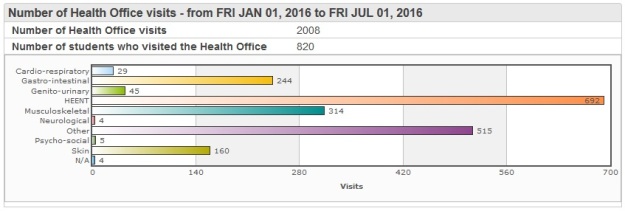
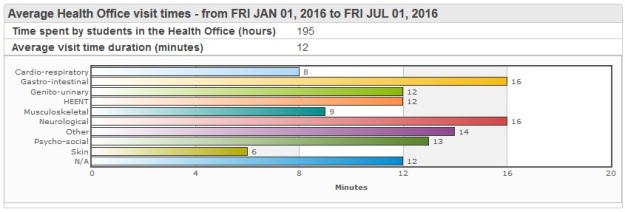
The result page showing the statistics will be split into two graphs (example given for time window: Jan 1st – Jul 1st, 2016):
- Number of Health Office visits
Includes the total number of office visits and total number of (unique) students during the Health Office over the specified time window.
- Average Health Office visit times
Includes the time spent by students and average visit time duration during the specified time window.
The statistics could be further refined/split in the future by, for example, school name (Middle School, High School a.s.o.) or by school year (thus eliminating the need of having tho choose the from/to dates yourself). Of course statistics similar to the above can be done for Immunizations and Screenings, should you be needing them.
There is virtually no limit to what can be done (counted, displayed and analyzed) on the pattern above as long as the data is there, in your database, and it is consistent (that’s extremely important when you’re doing statistics/graphs).
You can download this customization (as a PowerSchool plugin) here or here. Once installed, you will find its main page called HO_visits_graphs.html under /admin/dashboard. You can then create a link to this page and add it to the left-hand menu or pretty much anywhere you want.
You can email me any comments or questions you might have.

Any way to have this run for the school that you are logged in to?
LikeLike
Yes, Kevin, you could, you just have to make sure you pass the schoolid of the school you’re logged in to – that is ~(curschoolid) – to all the necessary pages (for ex. in ho_visit_type.html add smth like “&curschool=~(curschoolid)” to both url1 and url2 vars etc.).
But it could get tricky here. HO visit information is not directly linked to schools (or school ids). The only link will be via the student. So, you have to ask yourself: “do I want only current (year) data/statistics?” if the answer is yes then you can do it, you’ll just have to join the psrw_healthofficevisits view with the students table (by studentid) and add the condition “where student’s schoolid=currentschoolid”. If the answer is no, meaning you want “historical” HO visits data as well, then things get really, really complicated. You’d need to start from the dates and see how many school years they span and then for every single year in the time span look into the re-enrollments table to get all students that had their schoolid=currentschoolid at the time.
I hope this helps.
LikeLike