Tag Archives: personalized solutions

Grades distribution graph

Another interesting (and very useful) customization I’ve been recently asked to do is a visual representation of the stored grades distribution by school/year/grading period (store code).

You start by choosing the school from a drop down box of schools in your district.

gd_001

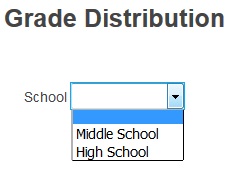
After choosing the school
gd_002
you will be presented with another drop down box listing the relevant school years.gd_003

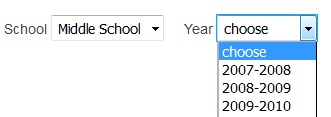
Again, after choosing the year
gd_004
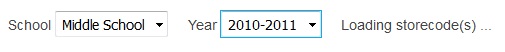
you’ll see yet another drop down appear, a drop down containing all the grading periods/bins (for the previously chosen school and year) that have stored grades in them.
gd_005

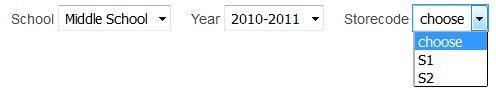
Once you’ve chosen the store code/grading bin you’ll have the option (the drop down on the second row) to order your grades a certain way.

gd_006

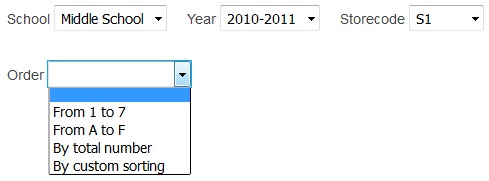
What the options mean:

  1. If you leave the field blank than the grades on the graph will be ordered “alphabetically” (A,A+,A- a.s.o. for letter grades and 1,2,3 a.s.o. for number grades).
  2. “From 1 to 7” – grades from 1 to 7 are listed first, from left to right, everything else comes afterwards ordered alphabetically.
  3. “From A to F” – proper ordering of letter grades (A+,A,A- a.s.o.), everything else comes afterwards ordered alphabetically.
  4. “By total number” – it counts the number of occurrences of each grade and orders them “ascending” (from 1 occurrence to 1000, let’s say).
  5. “By custom string” – allows you to choose, from the list of possible grades, the order in which you’d like them to be displayed (use drag & drop to move the grades around and change their left-to-right display order).
    gd_007

Whatever your choice was at the previous step, you can now press the submit button to see the results.

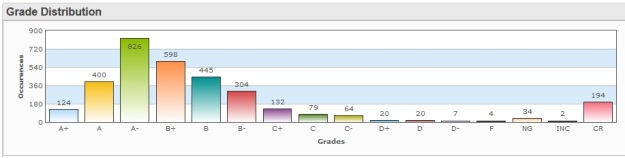
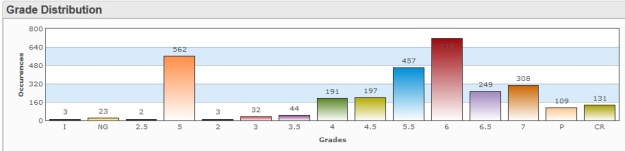
Below are some examples of how the graphs could look like, depending, of course, on your own grades in the database (and the order you choose).

Letter grades, ordered “From A to F”:
gd_008

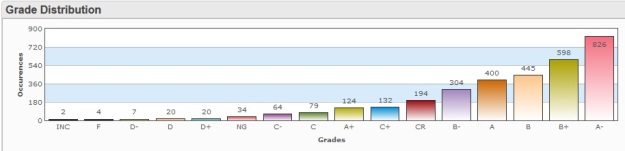
Letter grades, ordered “By total number”:
gd_009

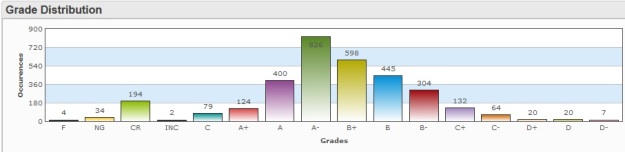
Letter grades, ordered “By custom sorting”:
gd_010
gd_011

Number grades, ordered “From 1 to 7”:
gd_012

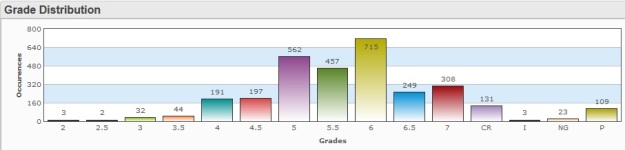
Number grades, ordered “By custom sorting”:
gd_013
gd_014

You could also report on, based on the same logic, the number of failed or incomplete grades (vs. total grades), or even create an extra option to the order drop down called “failed grades first” (to show first the failed grades and then the rest), for example.

There is virtually no limit to what can be done (counted, displayed and analyzed) on the pattern above as long as the data is there, in your database, and it is consistent (that’s extremely important when you’re doing statistics/graphs).

You can download this customization (as a PowerSchool plugin) here or here. Once installed, you will find its main page called grade_distribution.html under /admin/dashboard. You can then create a link to this page and add it to the left-hand menu or pretty much anywhere you want.

You can email me any comments or questions you might have.

Health Office visits statistics using graphs

Here is a customization I’ve done recently for the Health Office department of an international school.

Its purpose is to have a visual representation of the data collected every time a student enters the Health Office (office visits). In our case it will display statistics over “visit types” (as “categories”) and over “visit time” (as the difference between “time_out” and “time_in”).

The initial screen displays the title of the page, two date entry fields and a submit button.

ho_vt_01

You can bound your statistics to a certain time window by filling in both the “from” and “to” fields (or either one or the other, depending on your needs) or leave them both blank in order to get a statistics over the entire history of your office visits records (a “total over time”).

Once you chose your time window you can go on and press the submit button to display the results.

The result page showing the statistics will be split into two graphs (example given for time window: Jan 1st – Jul 1st, 2016):

  1. Number of Health Office visits
    Includes the total number of office visits and total number of (unique) students during the Health Office over the specified time window.ho_vt_02
  2. Average Health Office visit times
    Includes the time spent by students and average visit time duration during the specified time window.ho_vt_03

The statistics could be further refined/split in the future by, for example, school name (Middle School, High School a.s.o.) or by school year (thus eliminating the need of having tho choose the from/to dates yourself). Of course statistics similar to the above can be done for Immunizations and Screenings, should you be needing them.

There is virtually no limit to what can be done (counted, displayed and analyzed) on the pattern above as long as the data is there, in your database, and it is consistent (that’s extremely important when you’re doing statistics/graphs).

You can download this customization (as a PowerSchool plugin) here or here. Once installed, you will find its main page called HO_visits_graphs.html under /admin/dashboard. You can then create a link to this page and add it to the left-hand menu or pretty much anywhere you want.

You can email me any comments or questions you might have.

Customized solutions that bring out the full potential of your PowerSchool platform

Do you want to make the most of your PowerSchool platform?
Do you need help developing and implementing PowerSchool projects for your school?
Would you like to train your staff to use PowerSchool to its full potential?
Are you interested in finding out about customizations other schools have been using?
Would you like to see how your school could benefit from the experience of others?
Do you have a customization that stopped working and you need it fixed?

If your answer is Yes to at least one of the questions above, then you came to the right place.
For any questions and finding possible solutions to your PowerSchool needs, please contact: pshelp911@gmail.com

We will help you:

Make your PowerSchool Public Portal an unique experience by allowing your students and their families to have access to:

Bell Schedules

  • Fully customizable look & feel
  • Extensive info on periods and day/time of day, color coded, easy to read and print

Report Cards and Progress Reports

  • Web and printer-friendly versions
  • Based on Historical Grades, Standard Grades or a mix of the two

Transcripts

  • Web and printer-friendly versions (Head’s signature and seal of the school applied on it)
  • Fully customizable look & feel by grade or by division

IB programme

  • “Predicted grades” web and printer-friendly versions
  • Print official letters for the prospective universities

Data entry pages

  • Health Office, Field Trip, Travel, Activities information
  • On-the-fly update in the database or possibility to check and approve by an Admin staff first
  • Help parents help you with keeping their children important information up to date

Honor Roll and Student Recognition

  • Using built-in or customized data
  • Fully customizable look & feel, you can pull in any relevant data available on the student
  • Possibility to print the page as a “letter of recognition” (Head’s signature and seal of the school applied on it)

Empower your Admin staff and help them accomplish more by means of:

SQL-based reports

  • Extract, present and analyze any kind of student data
  • Simple and intuitive interface
  • Possibility to export the reports as text, CSV, TAB or Excel files

Data input and update pages

  • Input, view and update any kind of student data (built-in or customized)
  • Security based on customized group access lists
  • Applying to areas such as: Learning Support, Health-related information, school activities, IB diploma a.s.o.

Custom alerts

  • Quickly identify a student’s status pertaining to attendance, health, learning support, grades a.s.o.
  • Visible and suggestive alert texts and icons
  • Pop-up messages displayed on the student’s page
  • Email sent to designated addresses when a student reaches a specific status (defined at the school level)

IB programme progress monitoring

  • IB predicted grades coming from Gradebook or Historical Grades
  • Grades tracked over multiple sessions across both years of the IB programme
  • Compare the IB predicted grades for a student over multiple sessions or between students
  • Web and printer-friendly versions
  • Download/print official letters for the prospective universities

Keep your Teachers in the loop by ensuring their access to the necessary information:

Teacher’s Schedule

  • Fully customizable look & feel
  • Extensive info on periods and day/time of day, color coded, easy to read and print
  • Possibility to save the schedule as an “.ics” file to be imported in any type of calendar (Outlook, Google a.s.o.)

Custom alerts

  • Quickly identify a student’s status pertaining to attendance, health, learning support, grades a.s.o.
  • Visible and suggestive alert texts and icons
  • Pop-up messages displayed on the student’s page in PowerTeacher
  • Email sent to the email addresses all the teachers of a student when the student reaches a specific status (defined at the school level)

Access to important student data

  • Learning Support (reading/writing accommodations, counseling, special education a.s.o.)
  • Health (allergies, life-threatening conditions, what to do in case of an emergency a.s.o.)
  • Activities (after school, vocational, athletics a.s.o.)