Remember to always back up your data before making any changes to it.
Always try out your customizations on a test server first, NOT the live one.
The following customization was tested in PowerSchool 7.11.1, so it might not work in the newer versions.
The following customization was not tested in Internet Explorer.
For this customization you will also need an icon/image (preferably square and less or about 32×32 pixels) for the “settings/options” functionality (the “wheel” in the top-right corner). You may also want to consider having a photo to be used by default if there’s no photo for a particular student in the database (because our student numbers are 5-digit long mine is called 00000.jpg and it is a 400×600 “no-image” JPG file).
First off let’s admit it: we all like photos. The visual representation that it’s added to whatever data you’re presenting makes the data (which is sometimes quite dry and abstract) not only more comprehensible, more entertaining, it also adds a human dimension to it. And when it come to student photos it’s usually the photo itself (rather than the name) that triggers that opens folder in your head that holds all the important files on the student.
Well, I don’t know about you, but people in my school are really fond of their students’ photos, that’s why they’ve asked me to put them on almost every student report. That’s really an easy task, even with PowerSchool‘s out-of-the-box features.
But what if you want to have a list of photos of several students all on one page/report? Like if you want to have a list with the photos of all the students in a division (full name, grade, homeroom) or if you’d want to print the photos of all the students (name, dob, grade) going on a field trip or if you simply want to identify a, let’s say, 9th grader (could even be a new student, to make your task more complicated) that you saw on the field doing a no-no during his/her PE class.
We all agreed that an entirely new (custom) page, built from scratch, that will allow us to do just that (and, with a little bit of tweaking even more than that) could come in really handy at times.
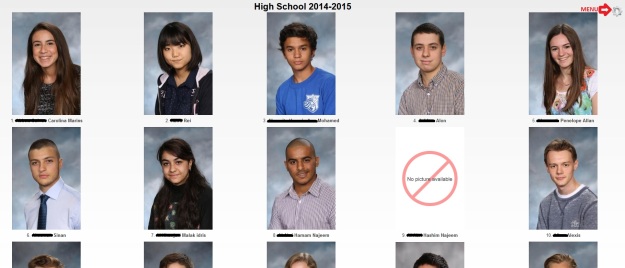
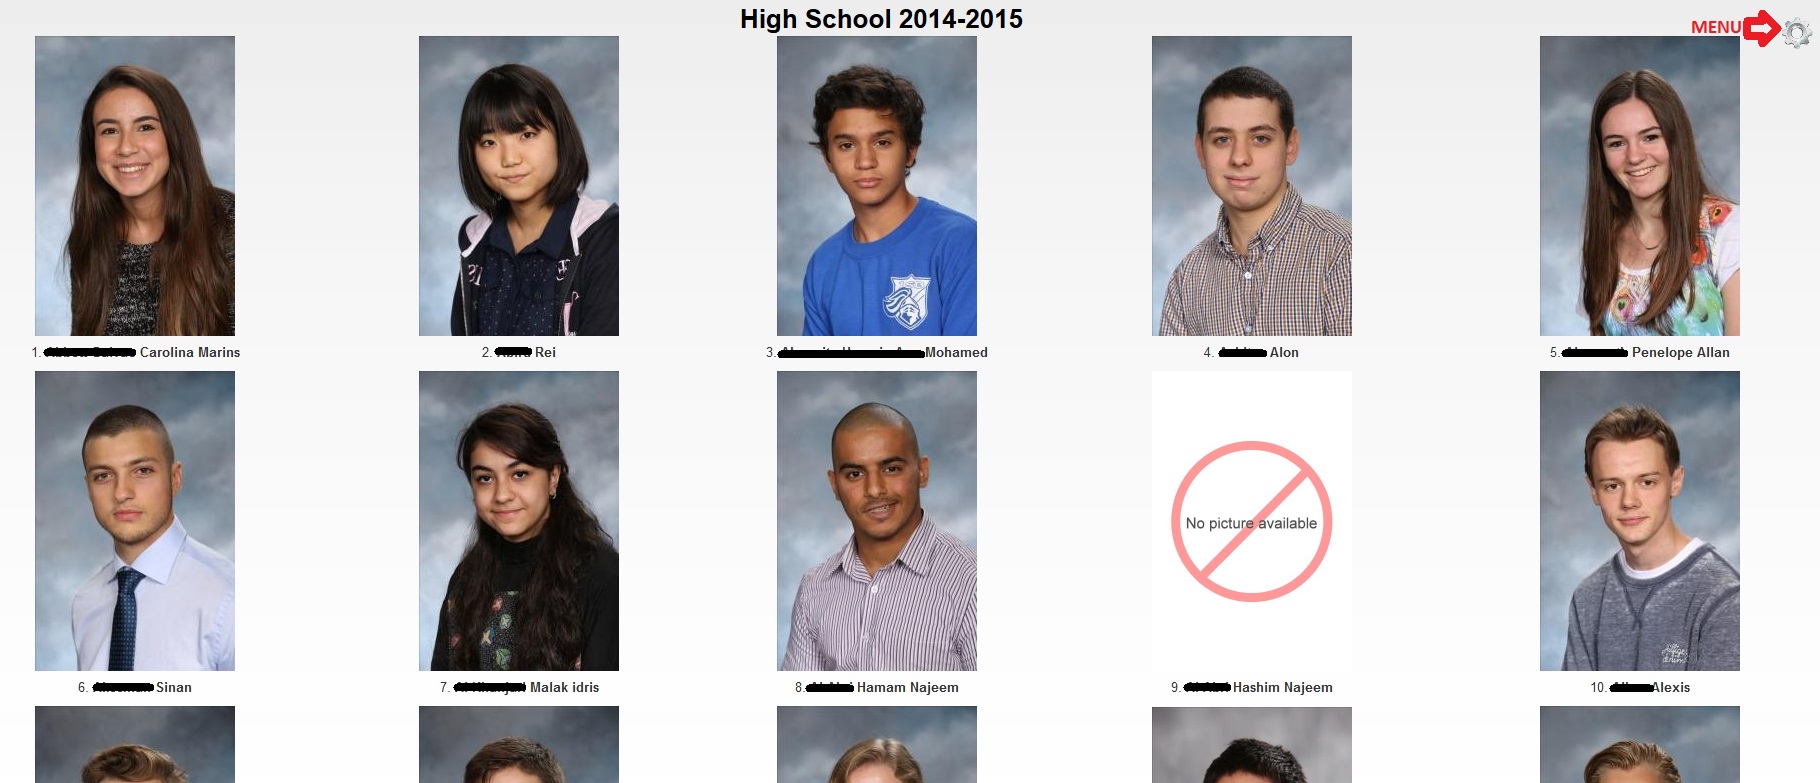
“Student Photos” page
There’s also a menu/options pop-up that allows you to show/hide student or school data on the page.
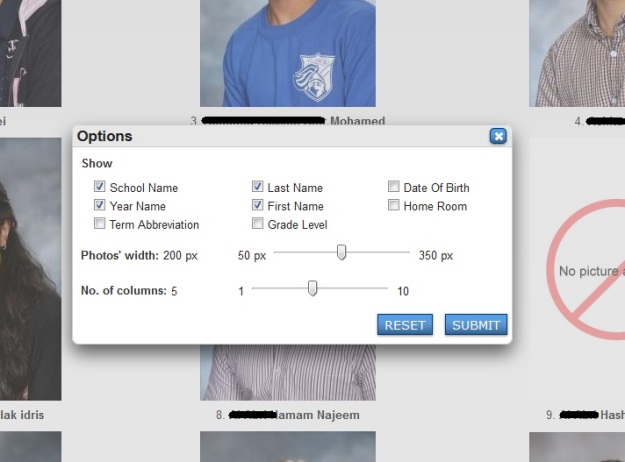
“Student Photos” menu/options
I thought it would be a good idea to place a link to this “Student Photos” page on the Admin home page (so to display the photos all the students in that division)
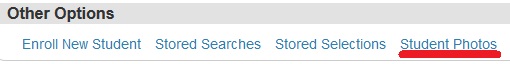
“Student Photos” link on the home page of the Admin portal
but also add it as an option in the Group Functions drop-down menu (so to easily display the photos of the students in the selection you just made).
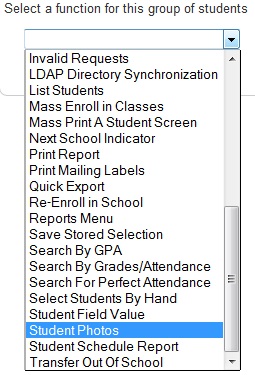
“Student Photos” option in the Group Function drop-down
Now let’s get to the juicy part – the HTML page. The way the code is written allows you to call your page (the HTML file) anyway you want and place it pretty much anywhere you want in the Admin folder (or sub-folders) – I chose to call it photos_new.html and I placed it in /admin/students.
<!DOCTYPE html>
<html>
<head>
<title>Student Photos</title>
<link href=”/images/css/screen.css” rel=”stylesheet” media=”screen”>
<link href=”/images/css/print.css” rel=”stylesheet” media=”print”>
~[wc:commonscripts]
~[SetPostValue:dothisfor=selected]
~[x:GetDoThisForStudents]
<!– define here only the default values, otherwise value assumed blank, 0 or unchecked –>
<!– only if the form hasn’t been submitted already –>
~[if#main.~[gpv:btnSubmit]=]
~[if#1.~[gpv:cols]=]~[SetPostValue:cols=5][/if#1]
~[if#2.~[gpv:showSN]=]~[SetPostValue:showSN=1][/if#2]
~[if#3.~[gpv:showYN]=]~[SetPostValue:showYN=1][/if#3]
~[if#4.~[gpv:photoW]=]~[SetPostValue:photoW=200][/if#4]
~[if#5.~[gpv:showLN]=]~[SetPostValue:showLN=1][/if#5]
~[if#6.~[gpv:showFN]=]~[SetPostValue:showFN=1][/if#6]
[/if#main]
<style type=”text/css” media=”print”>
thead {display: table-header-group; }
tfoot {display: table-footer-group; }
thead th, thead td {position: static; }
table { -fs-table-paginate: paginate; }
</style>
<style>
/* hide the elements of the no-print class when printing the page*/
@media print
{
.no-print, .no-print *
{
display: none !important;
}
}
html, body {
overflow: auto;
}
/* make the menu wheel fixed on the page – always sticking to the top-right corner*/
#fixedElement {
position: fixed !important;
top: 20px;
right: 20px;
}
span.chkOpt{
text-indent: 20px;
display: block;
}
/* set the width of the menu DIV that pops-up */
div#hiddenDivDialog{
width: 500px;
}
#mainTable th{
text-align: center;
vertical-align: middle;
font-size: 2em;
font-weight: bold;
line-height: 2em;
background-color: transparent;
}
/* set the size of the menu link (“the weel”) */
img#menuLink{
width: 32px;
height: 32px;
}
</style>
<script>
//will be used to point to the default (relative) path to the “no image” photo (shown by default if the actual student photo doesn’t exist or in case of a loading error)
//in this case the “no image” photo resides in the same folder as the html file itself
var noStudentImage = “00000.jpg”;
//will be used to point to the path to the “options icon” (shown in the top-right corner)
//in this case the “options icon” resides in the same folder as the html file itself
var optionsIcon = “settings.png”;
//displays the current value of a slider in the span element next to the appropriate label and then sets the slider itself to the corresponding value
function displayCurrentSliderValuePhoto(spanId,sliderId,value){
$j(“#” + spanId).html(value + ” px”);
$j(“#” + sliderId).val(value);
}
function displayCurrentSliderValueCols(spanId,sliderId,value){
$j(“#” + spanId).html(value);
$j(“#” + sliderId).val(value);
}
//once the content of the page has been loaded into the browser
$j(document).ready(function(){
//set the action property to the form to point to the page itself
$j(“#myForm”).attr(“action”, window.location.protocol + “//” + window.location.hostname + “/” + “~[self]”);
//set the 2 sliders to the right values (either default or passed to the page via submitting)
$j(“#photoW”).val(~[gpv:photoW]);
$j(“#cols”).val(~[gpv:cols]);
//change the text in the associated spans to reflect the values of the sliders
$j(“#phWspan”).html(~[gpv:photoW] + ” px”);
$j(“#noColspan”).html(~[gpv:cols]);
//on clicking the Reset button all options are reset (i.e. a call without any parameters is made to the page)
$j(document).on(‘click’, ‘#btnReset’, function() {
window.location.href = window.location.protocol + “//” + window.location.hostname + “/” + “~[self]”;
});
//on changing/moving the sliders the associated span’s text changes accordingly
$j(document).on(‘change’, ‘#photoW’, function() {
$j(“#phWspan”).html($j(this).val() + “ px”);
});
$j(document).on(‘change’, ‘#cols’, function() {
$j(“#noColspan”).html($j(this).val());
});
});
</script>
</head>
<body>
<!– the menu/page settings (“the wheel”) –>
<a class=”dialogDivM no-print” id=”fixedElement” title=”Options” href=”#hiddenDivDialog”><img src=”settings.png” id=”menuLink” class=”no-print” /></a>
<!– building the big table that will actually hold the photos –>
<table id=’mainTable’>
<thead>
<tr>
<th colspan=’~[gpv:cols]’>~[if.~[gpv:showSN]=1]~(schoolname)[/if] ~[if.~[gpv:showYN]=1]~(yearname) [/if]~[if.~[gpv:showTA]=1]~(termabbr)[/if]</th>
</tr>
</thead>
<tbody>
<tr>
~[tlist_sql;SELECT studid, studlastname, studfirstname, grlvl, studdob, studhr, CASE WHEN REMAINDER(row_num,~[gpv:cols])=0 then ‘</tr><tr>’ ELSE ” END AS rowend
FROM (SELECT s.id AS studid, s.last_name AS studlastname, s.first_name AS studfirstname, s.grade_level AS grlvl, to_char(s.dob,’MON DD, YYYY’) AS studdob, s.home_room AS studhr, ROW_NUMBER() OVER (ORDER BY last_name) AS row_num FROM students s WHERE ~[if.~[f.table_info;table=students;dothisfor=currentsel;fn=value;field=id;delim=cma]=]schoolid=~(schoolid)[else]s.ID in (~[f.table_info;table=students;dothisfor=currentsel;fn=value;field=id;delim=cma]-1)[/if] AND s.enroll_status=0)]
<td style=’text-align:center’><img src=’/admin/stp/~(studid)ph.jpeg’ width=’~[gpv:photoW]’ onError=\”this.src = noStudentImage;\”><br />~(count;-;if.test<~[gpv:cols];then=;else=</tr><tr>;). <span style=’display:~[if.~[gpv:showLN]=1]inline[else]none[/if]’><b>~(studlastname)</b> </span><span style=’display:~[if.~[gpv:showFN]=1]inline[else]none[/if]’><b>~(studfirstname)</b> </span><span style=’display:~[if.~[gpv:showGL]=1]inline[else]none[/if]’>(~(grlvl))</span><br /><span style=’display:~[if.~[gpv:showDOB]=1]block[else]none[/if]’>~(studdob)</span><span style=’display:~[if.~[gpv:showHR]=1]block[else]none[/if]’>~(studhr)</span></td>~(rowend)
[/tlist_sql]
</tr>
</tbody>
</table>
<!– the menu DIV with the options on it that pops-up when “the wheel” is clicked–>
<div id=”hiddenDivDialog” class=”hide”>
<!– the form with the options/check boxes, sliders and the two Reset/Submit buttons on it –>
<form id=”myForm” name=”myForm” method=”post”>
<table id=”menuTable”>
<tr>
<td colspan=”2″>
<label>Show</label>
</td>
</tr>
<tr>
<td style=”vertical-align:top”>
<span class=”chkOpt”>
<input type=”checkbox” name=”showSN” id=”showSN” value=”1″ ~[if.~[gpv:showSN]=1]checked[/if]>School Name
</span>
<span class=”chkOpt”>
<input type=”checkbox” name=”showYN” id=”showYN” value=”1″ ~[if.~[gpv:showYN]=1]checked[/if]>Year Name
</span>
<span class=”chkOpt”>
<input type=”checkbox” name=”showTA” id=”showTA” value=”1″ ~[if.~[gpv:showTA]=1]checked[/if]>Term Abbreviation
</span>
</td>
<td style=”vertical-align:top”>
<span class=”chkOpt”>
<input type=”checkbox” name=”showLN” id=”showLN” value=”1″ ~[if.~[gpv:showLN]=1]checked[/if]>Last Name
</span>
<span class=”chkOpt”>
<input type=”checkbox” name=”showFN” id=”showFN” value=”1″ ~[if.~[gpv:showFN]=1]checked[/if]>First Name
</span>
<span class=”chkOpt”>
<input type=”checkbox” name=”showGL” id=”showGL” value=”1″ ~[if.~[gpv:showGL]=1]checked[/if]>Grade Level
</span>
</td>
<td style=”vertical-align:top”>
<span class=”chkOpt”>
<input type=”checkbox” name=”showDOB” id=”showDOB” value=”1″ ~[if.~[gpv:showDOB]=1]checked[/if]>Date Of Birth
</span>
<span class=”chkOpt”>
<input type=”checkbox” name=”showHR” id=”showHR” value=”1″ ~[if.~[gpv:showHR]=1]checked[/if]>Home Room
</span>
</td>
</tr>
<tr>
<td>
<label>Photos’ width: </label><span id=”phWspan” style=”display:inline”></span>
</td>
<td colspan=”2″>
<table>
<tr>
<td style=”vertical-align:center”>
<span style=”display:inline”>50 px</span>
</td>
<td style=”vertical-align:center”>
<input type=”range” id=”photoW” name=”photoW” min=”50″ max=”350″ step=”10″>
</td>
<td style=”vertical-align:center”>
<span style=”display:inline”>350 px</span>
</td>
</tr>
</table>
</td>
</tr>
<tr>
<td>
<label>No. of columns: </label><span id=”noColspan” style=”display:inline”></span>
</td>
<td colspan=”2″>
<table>
<tr>
<td style=”vertical-align:center”>
<span style=”display:inline”>1</span>
</td>
<td style=”vertical-align:center”>
<input type=”range” id=”cols” name=”cols” min=”1″ max=”10″ step=”1″>
</td>
<td style=”vertical-align:center”>
<span style=”display:inline”>10</span>
</td>
</tr>
</table>
</td>
</tr>
</table>
<!– hidden field that tells us if the page was submitted or not (yet) – in this case, the page loads with the default values/parameters –>
<input type=”hidden” name=”btnSubmit” value=”1″>
<div class=”button-row”>
<button type=”button” id=”btnReset”>RESET</button>
<button type=”submit”>SUBMIT</button>
</div>
</form>
</div>
</body>
</html>
No more hassle with printing out student photos, this 100% customized PowerSchool page helps you achieve that in a couple of clicks. Simple as that! 😉